

This article is a step-by-step guide to help you create your first 4-Way Forecast and answer any technical questions you have.
Why you need a 4-Way Forecast
You're applying for a loan and your bank asks you for "forecasted financials". You have historical financials but how on earth do you create a forecasted profit and loss statement, balance sheet and cash flow statement that all link up with one another? Then, once you've figured that out, how do you include your business plans and expectations in the forecast? Meet Syft's 4-Way Forecast. 4-Way Forecast helps accountants and businesses create robust, transparent, integrated forecasts for management teams, clients, investors and financial institutions.
Creating your first 4-Way Forecast
Let's get started with you first 4-Way Forecast. Navigate to "Forecast" on the left-menu bar and then select "4-Way Forecast". You'll land on the 4-Way Forecasting dashboard. Now click "Add Forecast" and you'll be prompted to setup your first 4-Way Forecast.
- Select a name and description. It's useful to give your forecast a description so that you can create multiple forecasting scenarios for the same period. For example, 5-year best case forecast and 5-year worst case forecast.
- Select a start and end date. Forecasts can be from 1 month to 10 years!
- Select a forecasting interval. Interval options are either monthly, quarterly or yearly. If you create a monthly or yearly forecast, you'll still be able to download it in a condensed, annual view (more on this later!).
- Select the data for your forecast under populate with. There are four methods to create a starting point for your forecast. "Last period" and "Last value" use historical data while "Seasonality" and "Trend" apply a forecasting approach. All methods serve as a starting point for your forecast and are fully editable.
Selecting a starting point for your forecast
As mentioned above, there are four methods to create a starting point for your forecast. Let's unpack each of them in a little more detail:
- Last period - Populates the forecast with historical data from the last period repeatedly. For example, "Sales" for Oct 2021, Oct 2022, etc. would use actuals from Oct 2020. Similarly, "Sales" for Q3 2021, Q3 2022, etc. would use Q3 2020.
- Last value - Populates the forecast with historical data using the last value where data exists. For example, if the entity has data up until Jan 2020 then the forecast will populate all accounts using Jan 2020 values.
- Seasonality - Populates the forecast using the median year versus year growth rate over the past two years. For example, "Sales" for Oct 2021 would be equal to actual "Sales" from Oct 2020 multiplied by the median annual growth rate for "Sales".
- Trend - Populates the forecast using the median month versus month growth rate over the past two years. For example, "Sales" for Oct 2021 would be equal to actual "Sales" from Sep 2021 multiplied by the median monthly growth rate for "Sales".
If you want your forecast to start with historical data or "flat" data, we suggest using the last period or last value methods. Forecasting adjustments (which are discussed in the next section) will be more apparent under these methods. Seasonality and trend methods are useful if you want a quick 4-Way Forecast or don't have many adjustments to make to your forecast. Note that seasonality is the preferred method for stable entities with more than 2 years of data while trend is preferable for newer or high-growth entities.
Pro tip 💡 Once you generate your forecast, 4-Way Forecast will group certain accounts based on your chart of accounts setup. For example, all bank accounts will be grouped under cash and cash equivalents on the balance sheet. This is used to simplify your forecasting process and applies to bank accounts, inventory accounts, receivables accounts, payables accounts and VAT/GST accounts.
Syft calculates certain accounts on the balance sheet to create a baseline, specifically, accounts receivable, accounts payable, inventory and VAT/GST. On a side note, to apply an impact to accounts receivable, accounts payable or inventory, you'll use ratio forecasting adjustments (see the section "What's adjustable and what's not" below). To set the baseline for these accounts, the following methodology is used.
- Accounts receivable - Calculates the median of Account Receivable ÷ Sales for the previous 24 months of data (or the data that is available). Applies the calculated median to Total Sales for the forecasting period to arrive at values for Accounts Receivable.
- Accounts payable - Calculates the median of Account Payable ÷ Sales for the previous 24 months of data (or the data that is available). Applies the calculated median to Total Sales for the forecasting period to arrive at values for Accounts Payable.
- Inventory - Calculates the median of Inventory ÷ Sales for the previous 24 months of data (or the data that is available). Applies the calculated median to Total Sales for the forecasting period to arrive at values for Inventory.
- VAT/GST - Calculates the median of VAT/GST ÷ Sales for the previous 24 months of data (or the data that is available). Applies the calculated median to Total Sales for the forecasting period to arrive at values for VAT/GST.
Adding adjustments to your forecast
Once you've setup your forecast, the profit & loss statement, balance sheet, direct cash flow statement, indirect cash flow statement and financial ratios will be generated for the time period selected. Use the menu bar at the top of your screen to jump between each of the financial statements (any changes you make are automatically saved).
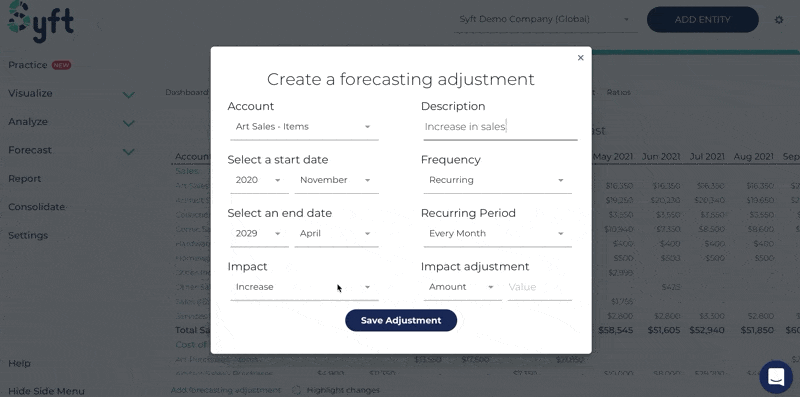
Now it's time to make adjustments to your forecast! Forecasting adjustments are things that you expect to happen in the future which will impact your financial position. There are an infinite number of options for forecasting adjustments - any adjustment you make should be specific to your business, plans and expectations. Typical plans include hiring a new team member, introducing a new product or buying a new vehicle.
To add an adjustment scroll down below the financial statements and click "Add forecasting adjustment". There are two types of adjustments, once-off adjustments and recurring adjustments:
- Once-off adjustments - These are adjustments that affect a single period (i.e. a single month, a single quarter or a single year). You can make these adjustments by clicking "Add forecasting adjustment" or editing any figure directly on the financial statements.
- Recurring adjustments - These are adjustments that affect multiple periods (i.e. two or more months, quarters, or years). Recurring adjustments can terminate at a specific date (for example, if you hire a consultant) or continue indefinitely (for example, renting a new office). You can make these adjustments by clicking "Add forecasting adjustment", editing any figure directly on the financial statements or clicking the account name you wish to impact.
Pro tip 💡 Click "Highlight changes" to see the impact of your adjustments across all financial statements! Any positive impact will be highlighted in green while any negative impact is highlighted in red.
Once you create an adjustment, it will be added to the 4-Way Forecasting adjustment table below the financial statements. Remember to provide a description for each adjustment so that you can determine the impact of each individual adjustment. Adjustments are also useful if you choose to export the forecast to PDF; it serves as a trail of forecasting changes that your team, clients, investors or your bank can read through.
Pro tip 💡 Click "Include" next to each forecasting adjustment to see the real-time impact on the financial statements.
Options for forecasting adjustments
There are several options for once-off and recurring adjustments. Although the options are self-explanatory, let's unpack each in a little more detail below:
- Increase - Apply an increase to the current value(s), this can be a nominal amount or percentage based.
- Decrease - Apply an increase to the current value(s), this can be a nominal amount or percentage based.
- Formula - Build a formula using any combination of accounts (current or prior period values) and arithmetic operators (that's +, -, × and ÷).
- New Value - Apply a new value that overrides the previous value.
What's adjustable and what's not
Now that we know how to add once-off and recurring adjustments as well as what functionality we have at our disposal, let's explore where we can apply adjustments and where we can't.
Profit and loss
You can apply a forecasting adjustment to all accounts. For grouped accounts, you need to apply forecasting adjustments to the underlying accounts that create the group. You can't apply forecasting adjustments on totals since these are automatically calculated.
Balance sheet
You can apply a forecasting adjustment to individual accounts except for accounts receivable, accounts payable, inventory, cash and cash equivalents, VAT/GST and retained earnings. These accounts are impacted as follows:
- Accounts receivable - impacted by the "Debtor's days" ratio. To impact accounts receivable, create a forecasting adjustment for "Debtor's days".
- Accounts payable - impacted by the "Creditor's days" ratio. To impact accounts payable, create a forecasting adjustment for "Creditor's days".
- Inventory - impacted by the "Inventory days" ratio. To impact inventory, create a forecasting adjustment for "Inventory days".
- Cash and cash equivalents - the balancing figure between your cash flow statements and the balance sheet.
- VAT/GST - impacted by total sales and the historical payment cycle of VAT/GST. Any increase or decrease in sales will have a proportional impact on the VAT/GST account.
- Retained earnings - dependent on the profit and loss statement.
Direct and Indirect cash flow statements
Forecasting adjustments can't be applied to the direct and indirect cash flow statements.
Ratios
Forecasting adjustments can be applied to the following ratios:
- Debtor's days - forecasting adjustments to "Debtor's days" will impact accounts receivable
- Creditor's days - forecasting adjustments to "Creditor's days" will impact accounts payable.
- Inventory days - forecasting adjustments to "Inventory days" will impact inventory.
All other ratios are calculated based on the profit and loss statement and balance sheet.
Exporting your 4-Way Forecast
Once you've created a complete 4-Way Forecast with all the forecasting adjustments you desire, you can see all your saved forecasts on your 4-Way Forecast dashboard. You can either edit a forecast (which will take you to the financial statements for that forecast), download a forecast or delete a forecast.
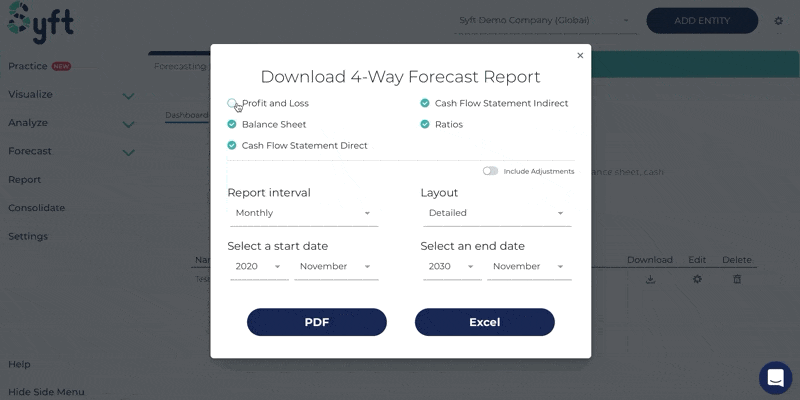
If you choose to download a forecast, you'll be given the following options:
- Financial statements - Select the financial statements to include in the download. Even though your forecast has all the financial statements, you may only want to export, for example, the profit and loss statement.
- Adjustments - Include or exclude the forecasting adjustments using the adjustment toggle.
- Report interval - Recall that you had the option to create your forecast either on a monthly, quarterly or yearly basis. You can export your forecast using the interval you created it with or combine the forecast into a different time interval.
- Layout - Select a detailed or summary layout. The detailed layout is the standard layout that includes all your accounts while the summary layout only shows the totals in each financial statement.
- Start and end date - Select which period you want to export from your forecast. You may want to extract a certain period of time from a 10 year forecast, for example, the next financial year, while leaving the rest of the forecast hidden.
- Format - Select either PDF or Excel format.
If you have any questions on 4-Way Forecasting or need further assistance, chat to one of our representatives using live-chat assist on the website or send us an email at info@syftanalytics.com.
Watch a video walkthrough on 4-Way Forecasting here.


.jpg)

.svg)


