

At Syft, we're celebrating Christmas in July. As part of that, we have a mid-year present for you: new budgeting visualizations!
Budgets on Syft are now more robust thanks to our new adjustment tables and visualizations! Budgeting adjustments are now easier to locate, add, and make sense of in beautiful graphical form courtesy of this latest update.
Plus, we've implemented changes to Audit and more! Read on for all the details.
Where did adjustments go? 🔎
You can now find your budgeting adjustments within the accounts that you have adjusted. Adjustments will be ordered by start date and we also show key totals that the account is impacting, i.e. the total of the category and total cash.
Pro tip 💡: A double set of arrows (up and down) will be located next to any category that has been adjusted to let you know that have been made to that account.
To add a new adjustment to your Profit and Loss or Balance Sheet, click "Add quick adjustment" or "Add advanced adjustment". You can then highlight the changes and dive down into more details with our new line graph visualizations.
All new visualizations 📊
You can now see your budgeting adjustments represented in a line graph within the accounts they are applied to. To do this, simply click on the adjusted account. This will open up a table and graph view where you can see the adjustment, its recurrence, impact on the budget, and who made this adjustment.
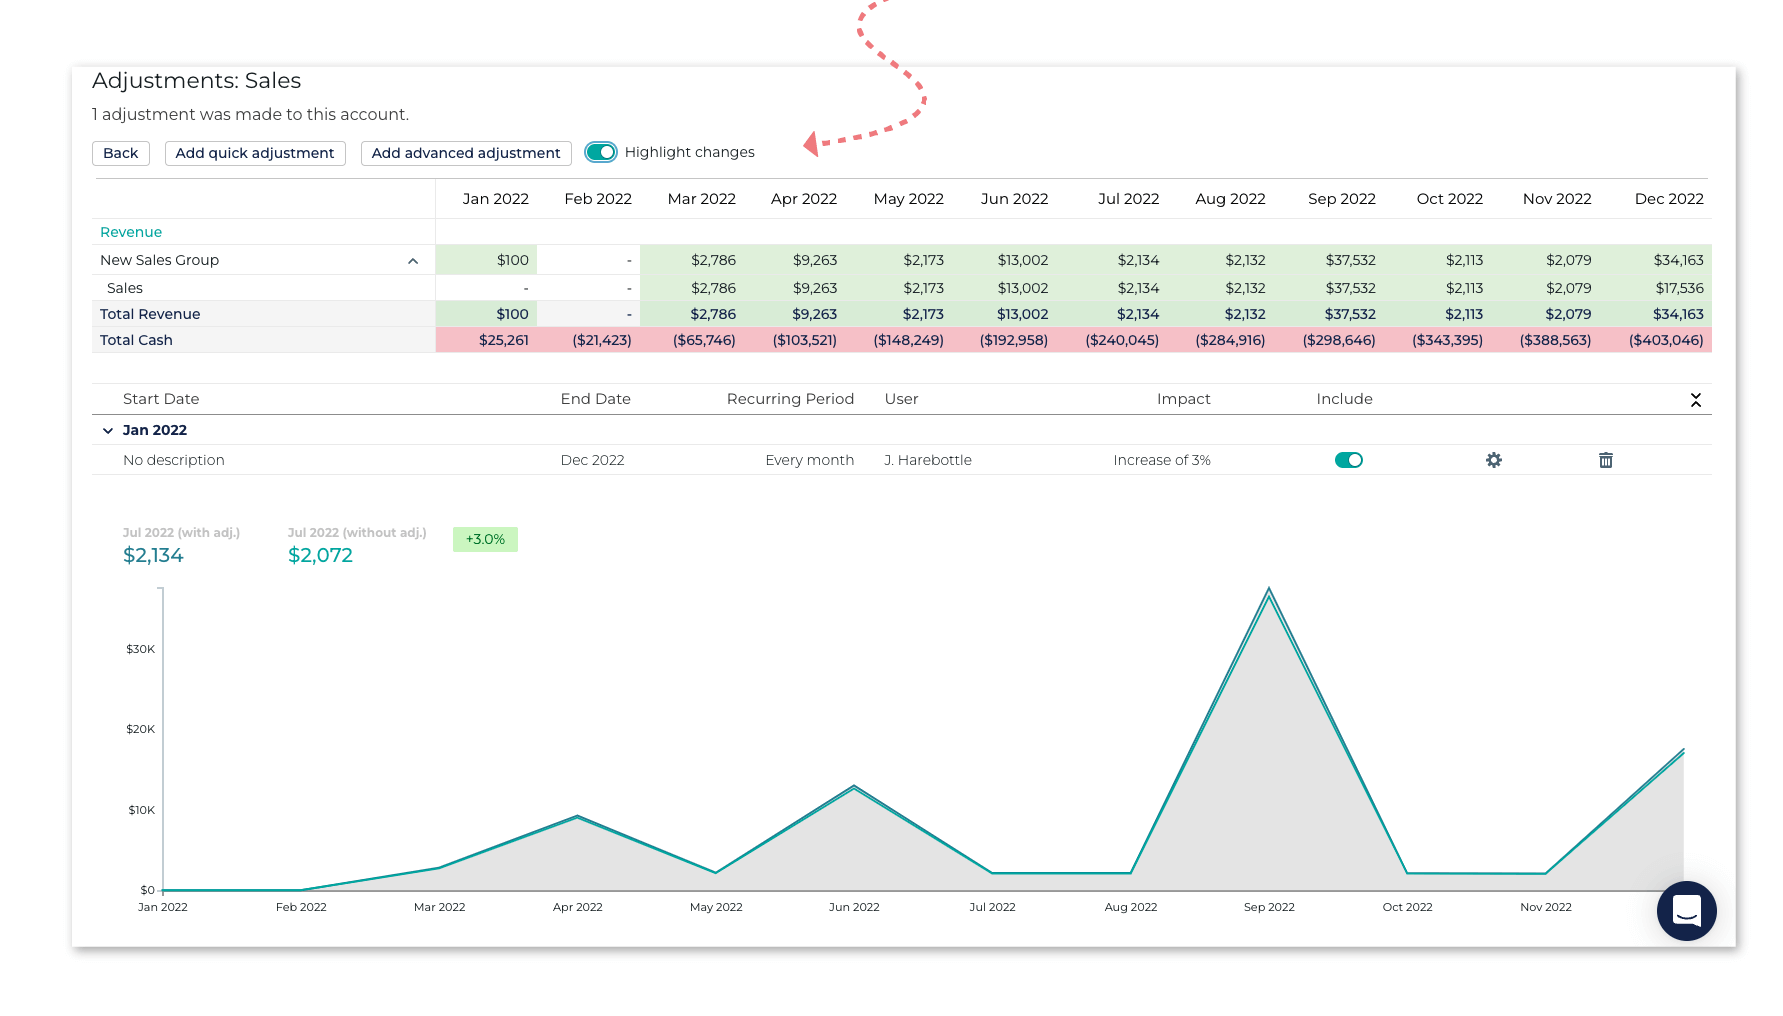
You can drill down into the details for every category and click on any points along the graph to see their value.
You can toggle adjustments on and off, and compare the adjusted data to un-adjusted budgets.
With the new visualizations and tables for your budgeting adjustments, budgets are easier to understand and use. And, we've also implemented some other updates and fixes this week.
Updates to Audit 🧐
In Audit Anomalies, when you take a look at your anomalies in accounts that are identified according to account movements and variances, you'll need be able to drill down into the details. By clicking on any card in Anomalies: Accounts: Variances, you will be able to see all the accounts that have been flagged as anomalous.
You can then drill down even deeper by analyzing this information in a bar graph and then clicking on the bars of the graph to see all the transactions comprising that bar.
Fixes ❤️🩹
This week's fixes include the following:
- Journals posted at the level of the consolidation to the underlying segment accounts now reflect in reports; and
- Balance Sheet Layouts automatically pull through to Balance Sheet under Financials.
I hope you'll find this useful! If you have any questions, please reach out to us over the live-chat assist.


